Dashboard
Your home screen: revenue, charts, latest orders, and store status at a glance.
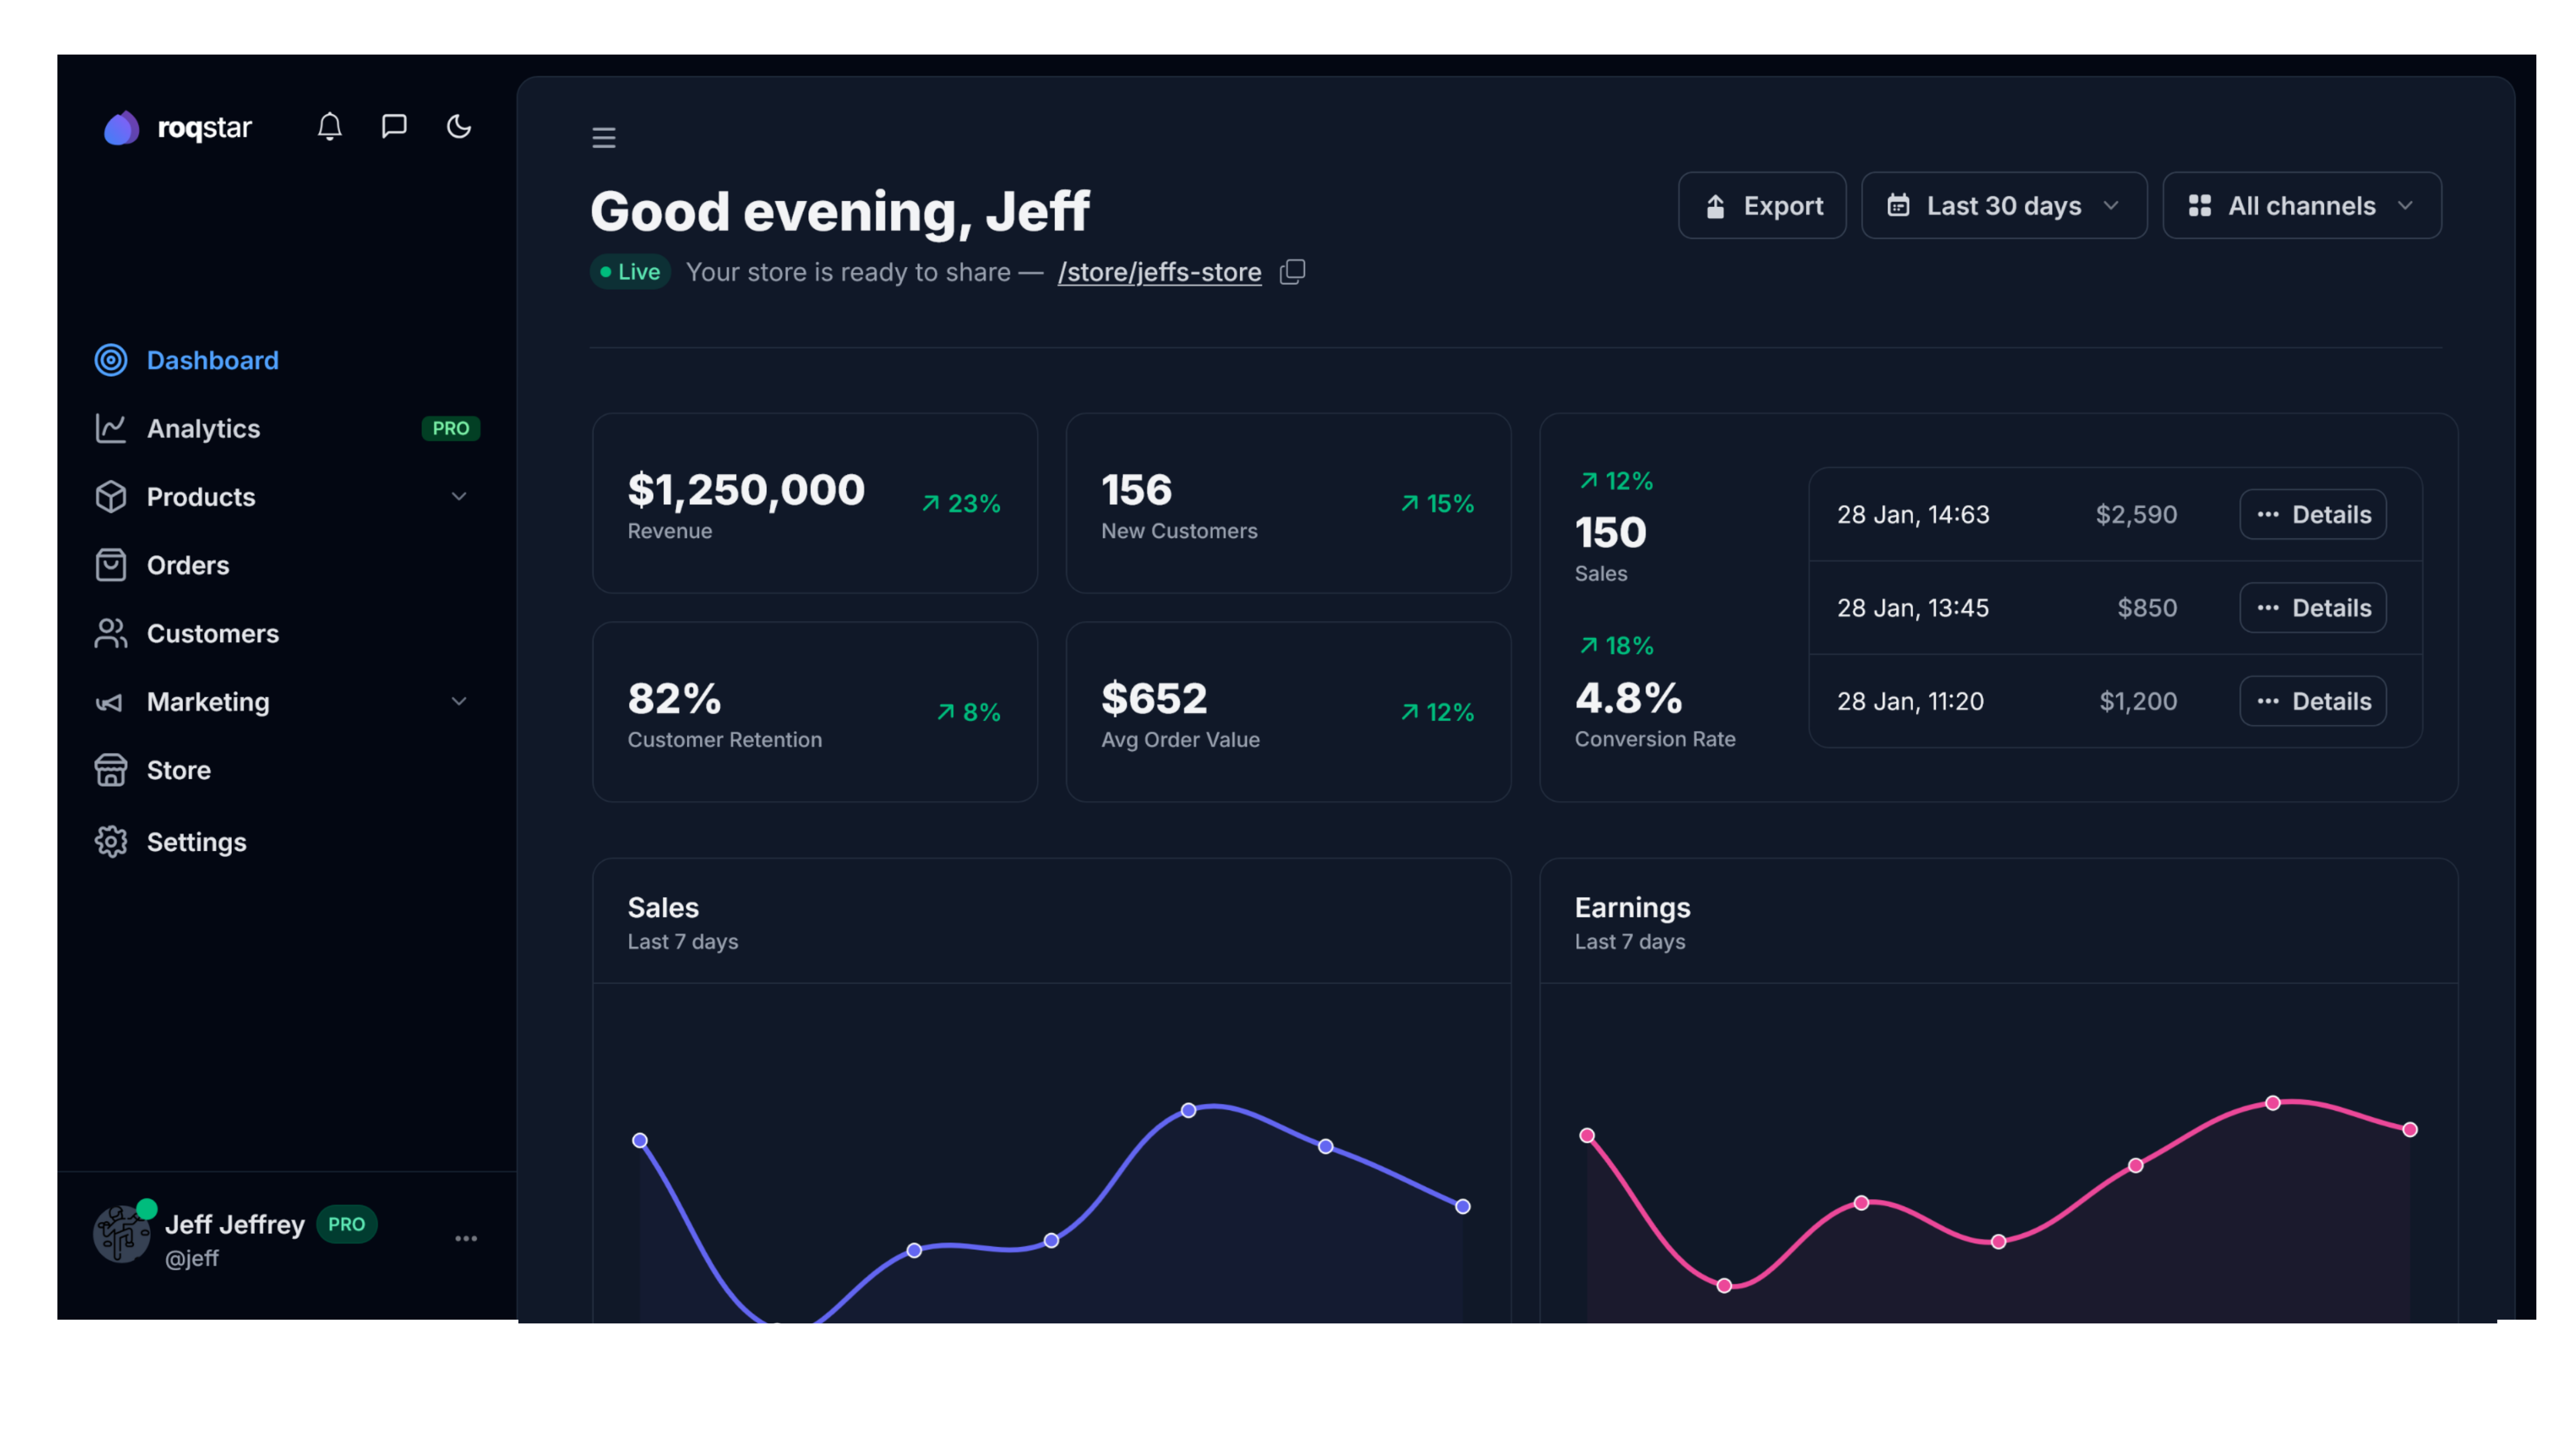
The Dashboard is the first screen you see after signing in. It is an overview of how your store is performing.
Top bar
- Greeting: a time-of-day greeting with your first name.
- Store status: a Live or Offline pill with your store URL (click to copy).
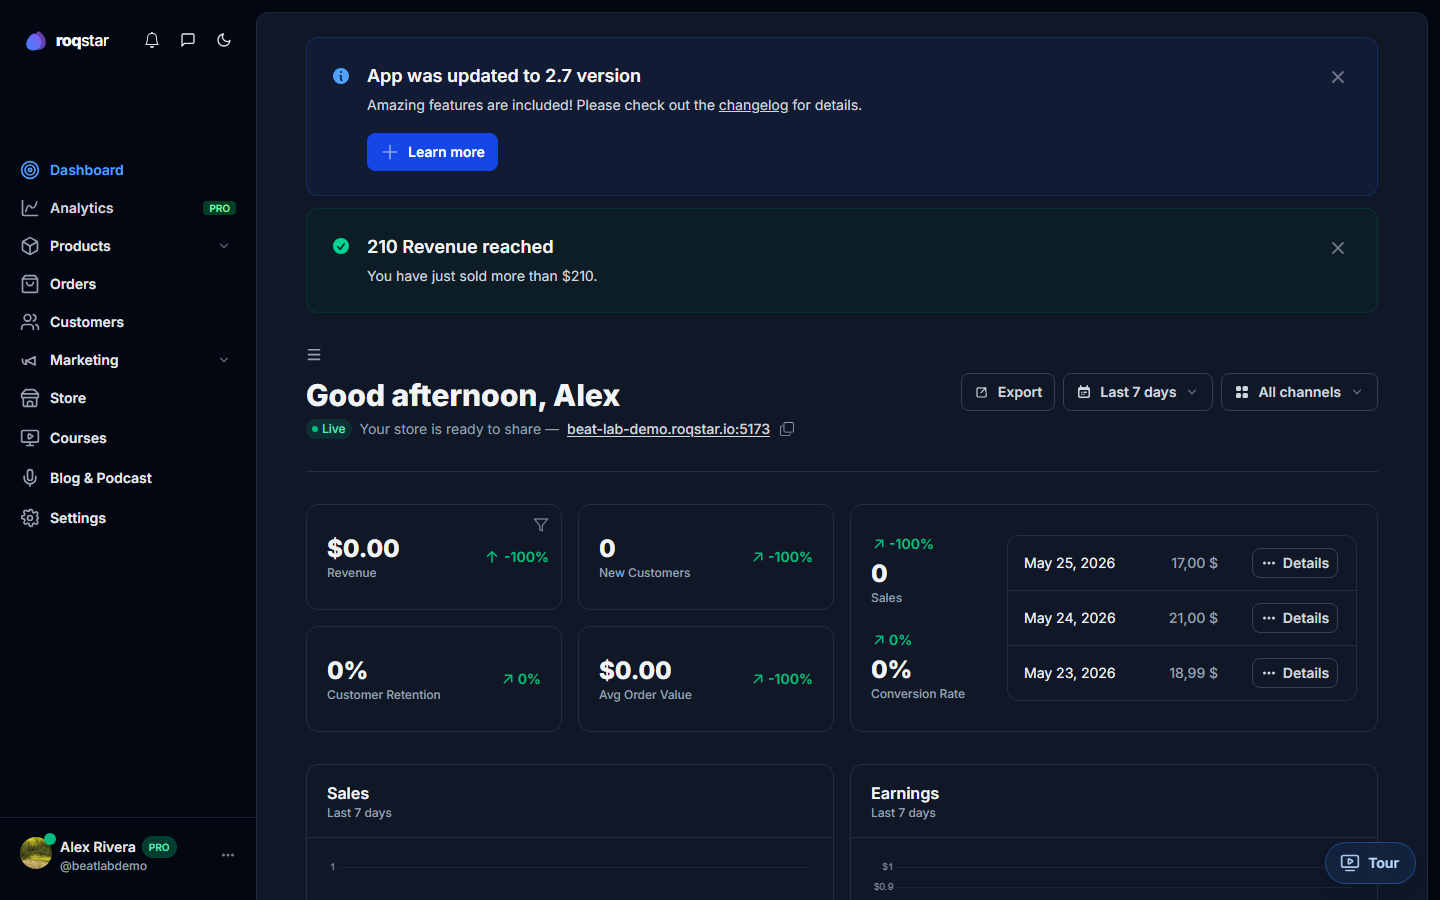
- Setup banner: shown until all setup steps are complete, with a count of remaining steps and a link to continue.
KPI cards
A row of stat cards summarizes your performance for the selected period. Each card also shows a percentage change against the previous equivalent period (for example, this 30 days versus the prior 30 days).
| Card | Meaning |
|---|---|
| Revenue | Total paid order value in the selected period (after discounts, before your processor fees). |
| New Customers | First-time buyers in the period. |
| Sales | Count of paid orders. |
| Conversion Rate | The share of store visitors who purchased. |
| Customer Retention | The share of buyers in the period who were repeat customers. |
| Average Order Value | Revenue divided by the number of orders. |
Charts
- Sales: order count over time.
- Earnings: revenue over time.
- Visitors: unique sessions on your store.
- Page Views: total page loads.
Time range
Use the dropdown to choose Today, Last 7 days, Last 30 days, This month, This year, All time, or a Custom range with a dual-month calendar picker.
Latest orders
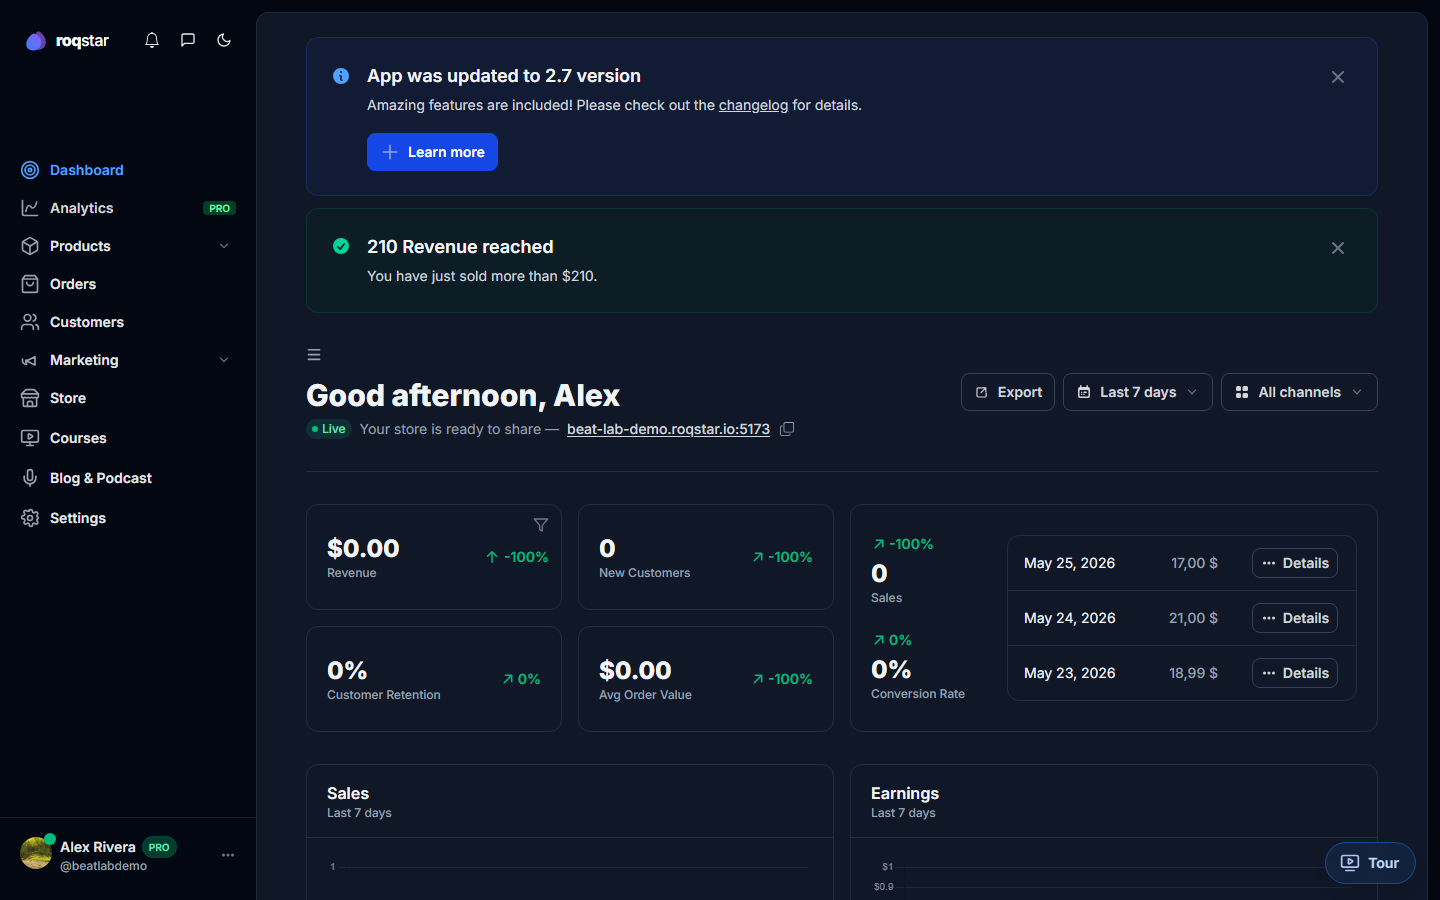
A table of recent orders shows date, amount, and a Details button that opens the full order in Sales. Filter by order status with the dropdown above the table.